Omnidirectional Reflector
A dielectric omnidirectional reflector Authors: Y. Fink, J. N. Winn, S. Fan, C. Chen, J. Michel, J. D. Joannopoulos, and E. L. Thomas Journal: Science 282(5394), 1679–1682 (1998) · Comparison target: Figure 4 https://doi.org/10.1126/science.282.5394.1679
Nine alternating layers of polystyrene and tellurium keep the entire 10–15 um band highly reflective across every incidence angle from 0° to 80° and in both polarizations — no alignment to a particular angle required.
This case builds that nine-layer stack from the published materials, thicknesses, and layer order, computes TE and TM reflectance at 0°, 45°, and 80°, and compares against all five panels of paper Figure 4.
At normal incidence, 10–15 um already sits inside a continuous high-reflectance plateau.
Background
Section titled “Background”An omnidirectional reflector is not defined by a single high-reflectance peak at one angle. The engineering requirement is a wavelength interval that stays highly reflective over a broad angular range and under both polarizations, so a device does not depend on precise single-angle alignment.
The published parameters map directly onto a one-dimensional stack: a PS-Te system, 9 layers alternating from Te, Te = 0.8 um and PS = 1.65 um, a target band of 10–15 um, and an angular range of 0°–80°.
Structure
Section titled “Structure”| Item | Model value | Reason |
|---|---|---|
| Incidence medium | Air | Consistent with the air-side reflectance measurement in the paper |
| Stack architecture | Te / (PS / Te) x 4 |
Nine layers total, equivalent to Te / PS / Te / PS / Te / PS / Te / PS / Te |
| Top Te layer | 0.8 um |
Published thickness |
| PS inside the repeated period | 1.65 um |
Published thickness |
| Te inside the repeated period | 0.8 um |
Published thickness |
| Te source | Two built-in Te entries, Caldwell-o and Sherman-o, merged |
The merged file spans 6–15 um, matching the Figure 4 axis |
| PS source | The built-in polystyrene entry | Extends to 20 um and preserves mid-IR absorption features |
| Transmission medium | Air | Isolates the stop-band behaviour of the nine-layer film |
The repeated part of the stack is a four-fold period, which a Layer Group expresses more easily than eight manually duplicated layers. Keep the top single Te layer, set its thickness to 0.8 um, set its material to File and upload the merged Te data file; remove the leftover standalone substrate row; then add a Layer Group with a repeat count of 4 containing PS at 1.65 um and Te at 0.8 um.
The completed structure page, with the single Te Entrance on top and the repeated PS-Te Period below:

Open Edit Group to check the period unit — repeat count 4, with PS and Te inside:

Optical Settings
Section titled “Optical Settings”| Setting | Value |
|---|---|
| Wavelength range | 6000–15000 nm |
| Step | 50 nm |
| Detector | Reflectance only |
| Angles | 0°, 45°, 80° |
| Polarization | TE as pRatio = 0, TM as pRatio = 1 |
The result page uses nm on the horizontal axis, so the paper’s 10–15 um band appears as 10000–15000 nm.

Simulation Results and Comparison with Figure 4
Section titled “Simulation Results and Comparison with Figure 4”The five comparisons follow the order of the paper’s sub-panels, one software result per condition; view the published panels in the original paper.
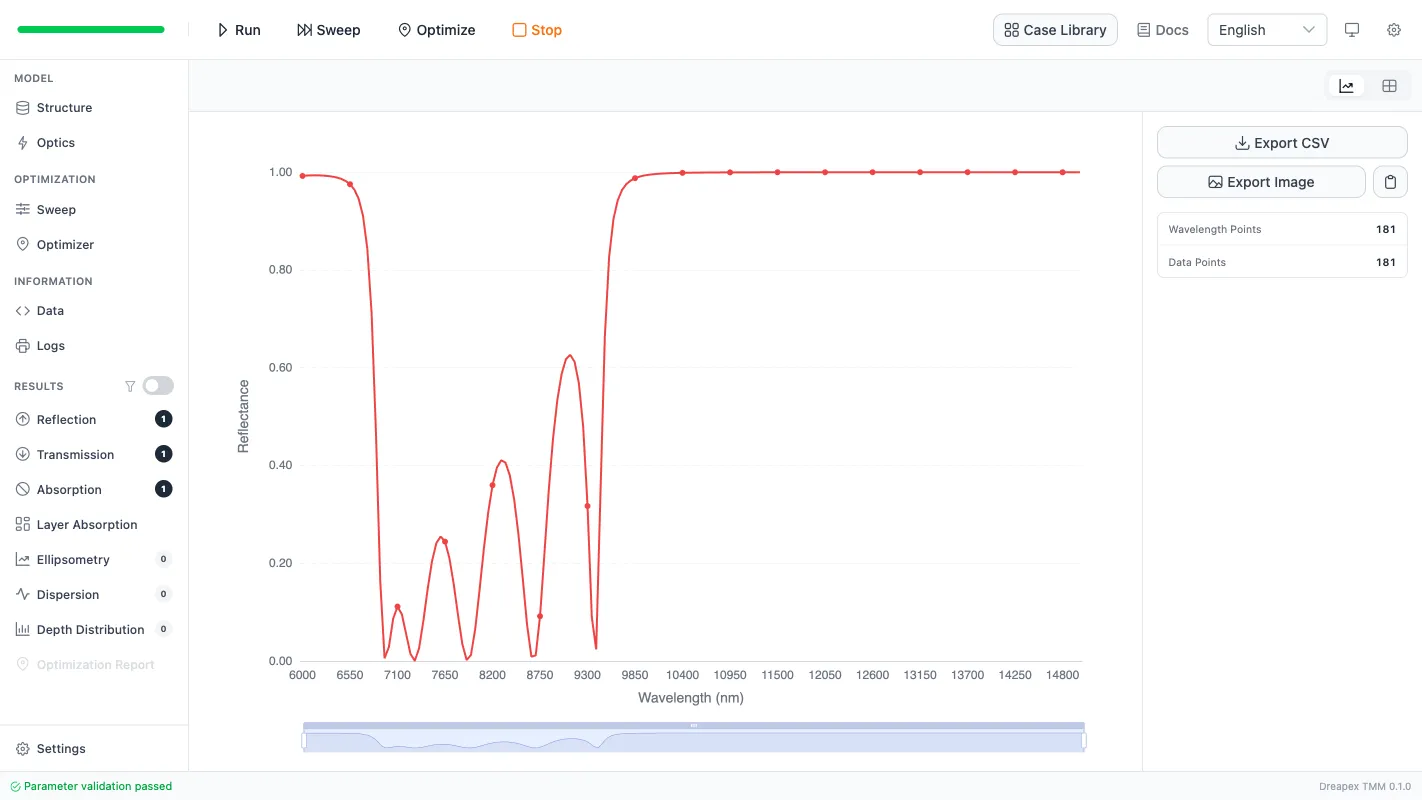
Normal incidence (0°):
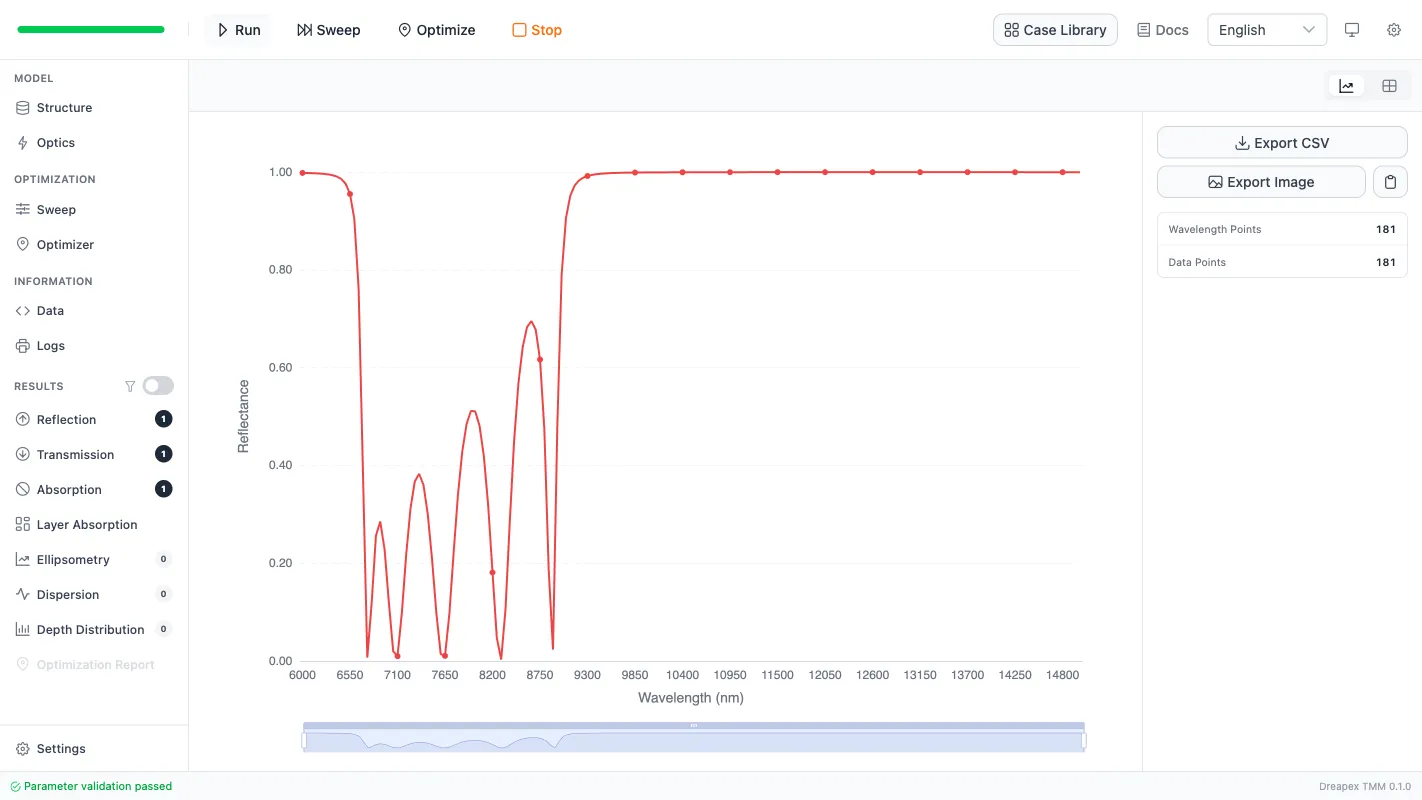
TE, 45°:
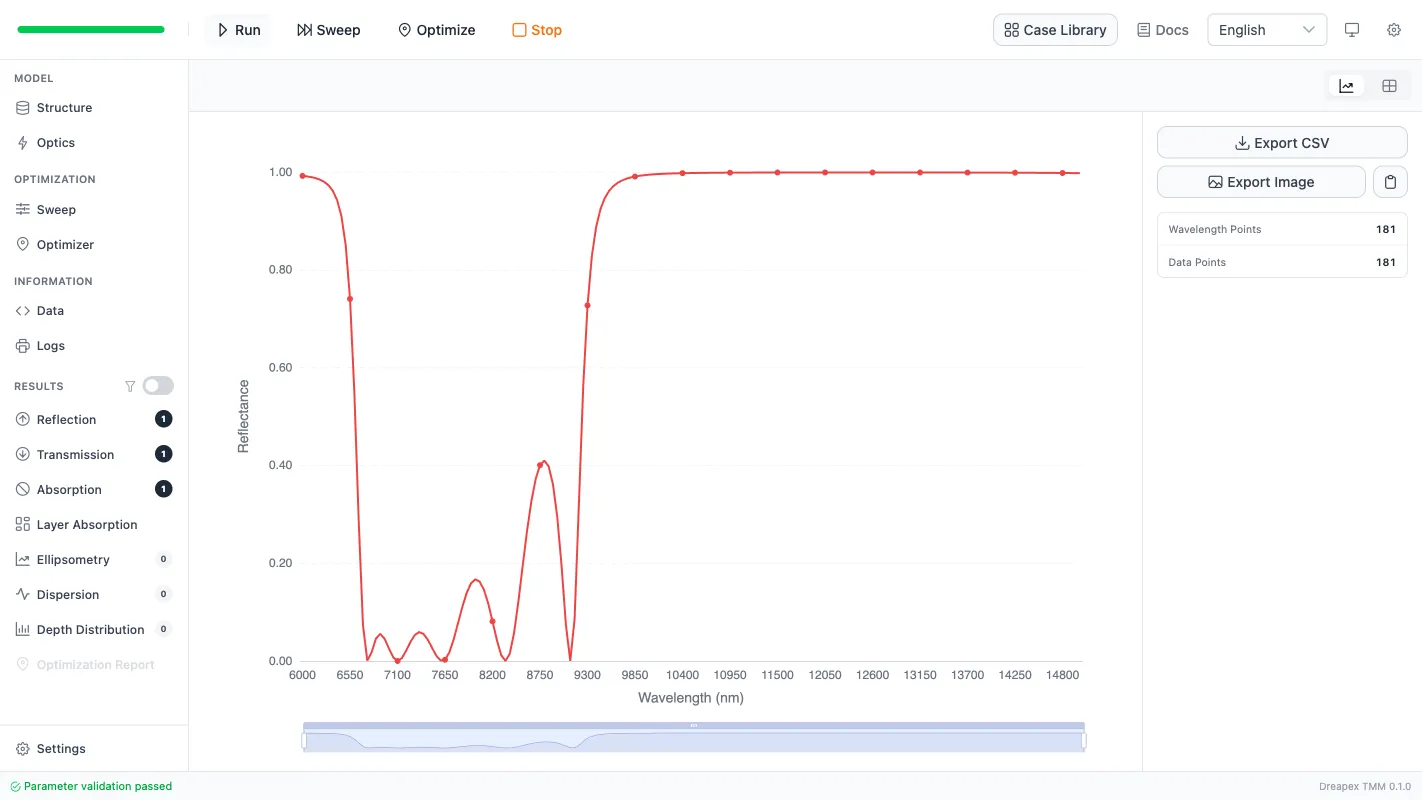
TM, 45°:
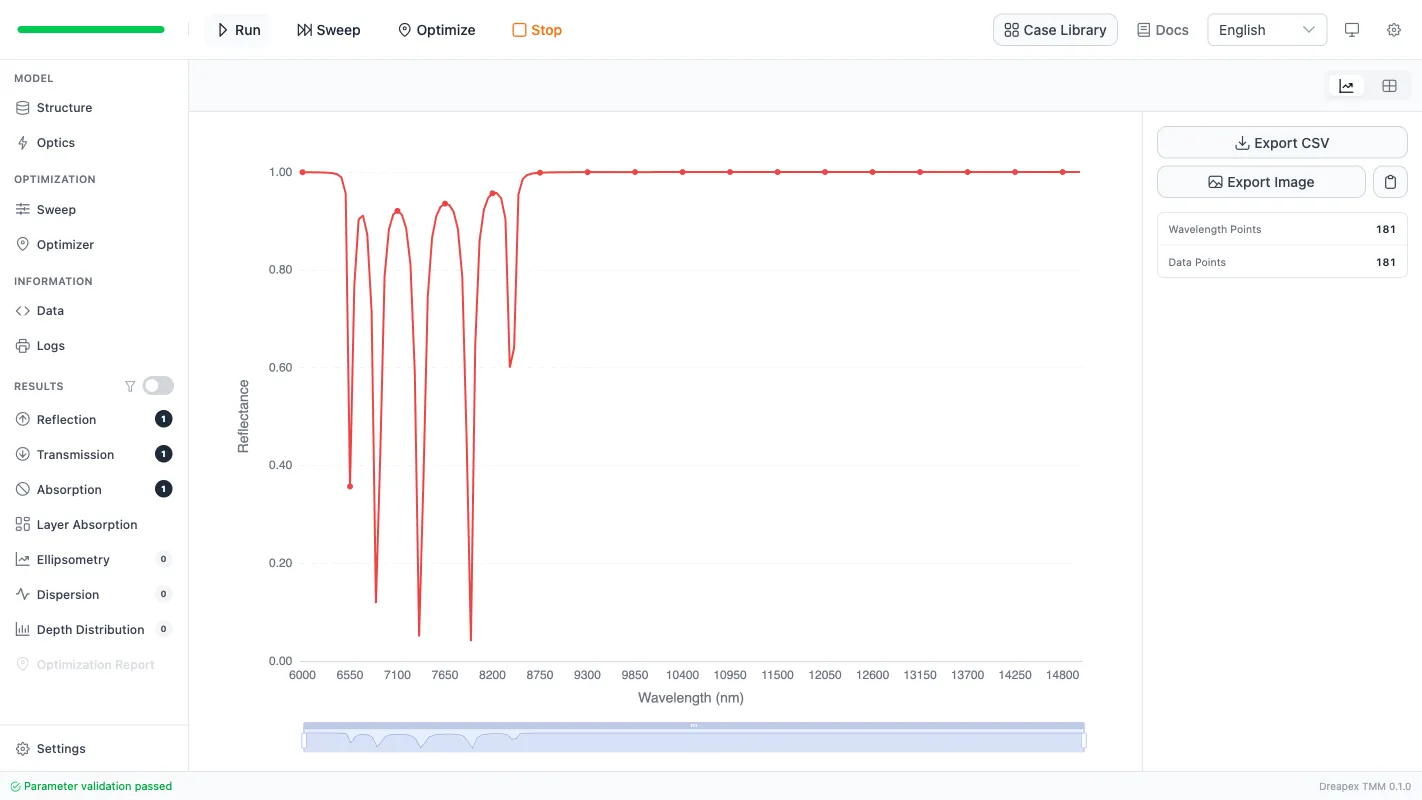
TE, 80°:
TM, 80°:
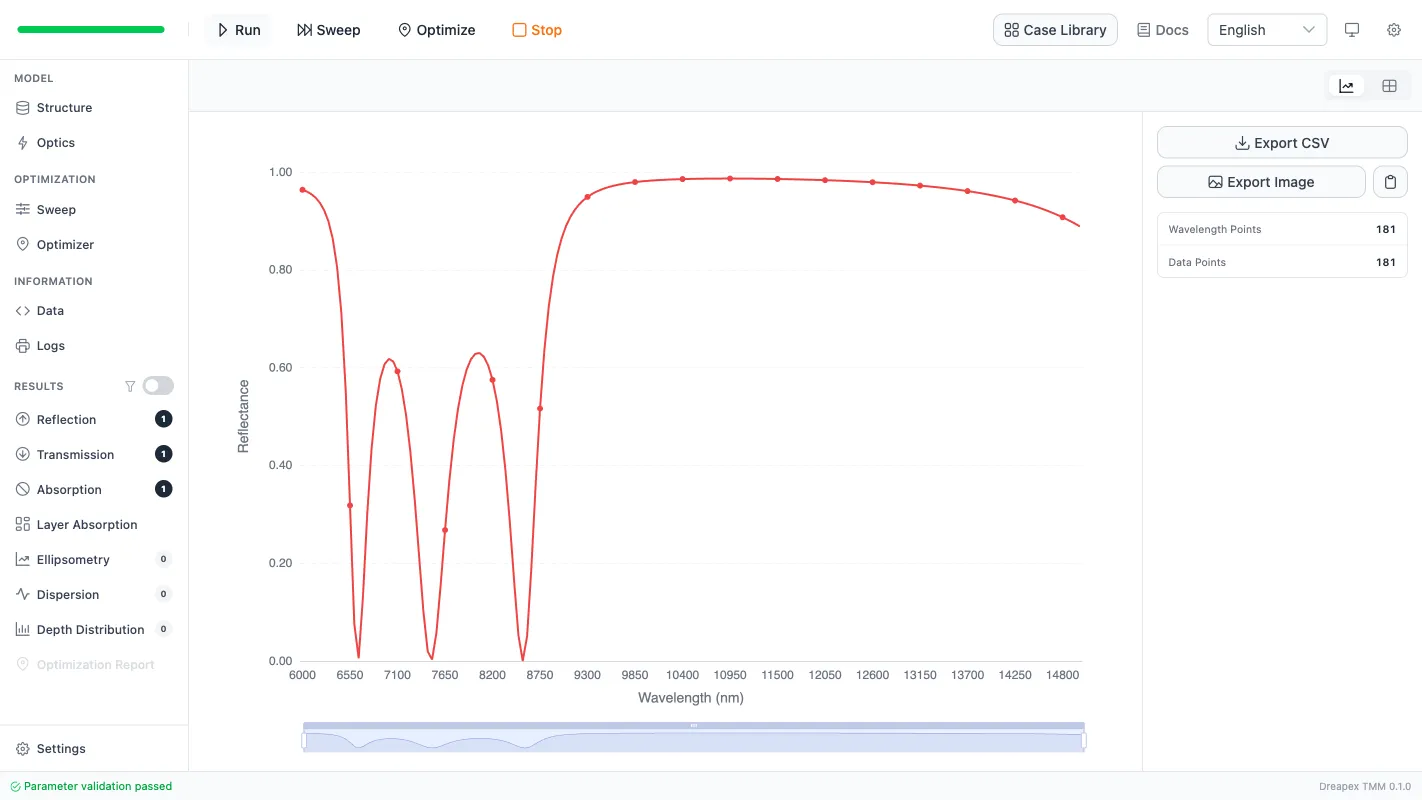
Placed next to Figure 4, the comparison is straightforward:
- At normal incidence, the
10-15 umtarget interval already lies inside a continuous high-reflectance region. - At
45°, bothTEandTMremain broad plateau-like high-reflectance responses rather than collapsing into narrow resonances. - At
80°, theTEbranch still keeps a broad plateau, while the short-wavelength edge ofTMshifts more strongly. That matches the paper’s physical interpretation that the more restrictive edge of the omnidirectional band is governed by theTMbranch. - The local dents visible in the platform are consistent with the mid-IR absorption of
PS, which the paper also notes.
The central conclusion is therefore reproduced at the correct level of rigor for a first pass: the structure behaves as a broad angular high-reflectance band, not as a single resonance peak.
Deviation Notes
Section titled “Deviation Notes”Both materials use published optical constants from the database rather than measurements of the 1998 samples, so absorption strength and fine structure will not match point by point. The Te file is merged from two database entries, which may leave a small line-shape kink near the handover around 9 um.
The model uses a free-film approximation with no real substrate, so absolute band-edge positions and local line shape are more idealized than a measurement. Process tolerances, interface roughness, and thickness drift are not included.
Going further
Section titled “Going further”These tutorials cover the operating steps only. The physics behind them, the full parameter reference for each feature, how to read the results, and the algorithm validation all live on the documentation site:
- Transfer-Matrix Method — the physics and formulas behind these tutorials
- Feature Guide — complete reference for every screen and parameter
- Results — how to read each kind of output
- Open Dreapex TMM — build and simulate in the browser